Viewing test results
Go to the "Results" page by clicking on the corresponding menu item.
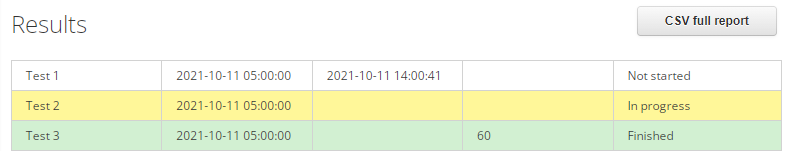
The "Results" page contains the table with tests and the button for downloading reports in "CSV" format. Click on it to download the report to your device.
The "Status" column can have one of three test statuses:
- "Not started" — none of the participants completed the test;
- "In progress" — not all the participants completed the test;
- "Finished" — all the participants completed the test.
Left-click on the row of the required test.
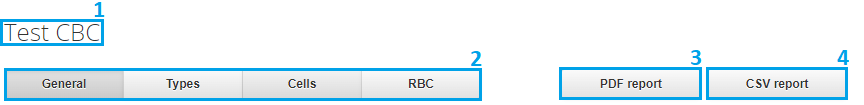
The results of the selected test (1), the report switching panel (2), the "PDF report" button (3), the "CSV report" button (4), and the contents of the selected tab will appear under the table. The set of buttons on the report switching panel depends on the types of samples included in the test.
To view the report in PDF format, click the "PDF report" button (3).

The report will open in a new browser window and will also be sent to your email address as an attachment. If the report does not open in a new window, you must allow pop-ups for this site in the browser settings.
You can save the report from the browser window or download it from the received email.
To save the report in CSV format, click the "CSV button" (4) and select the destination folder on your device.
Viewing test results for CBC samples
The report switching panel consists of 4 tabs: "General", "Types", "Cells", "RBC".
"General" tab
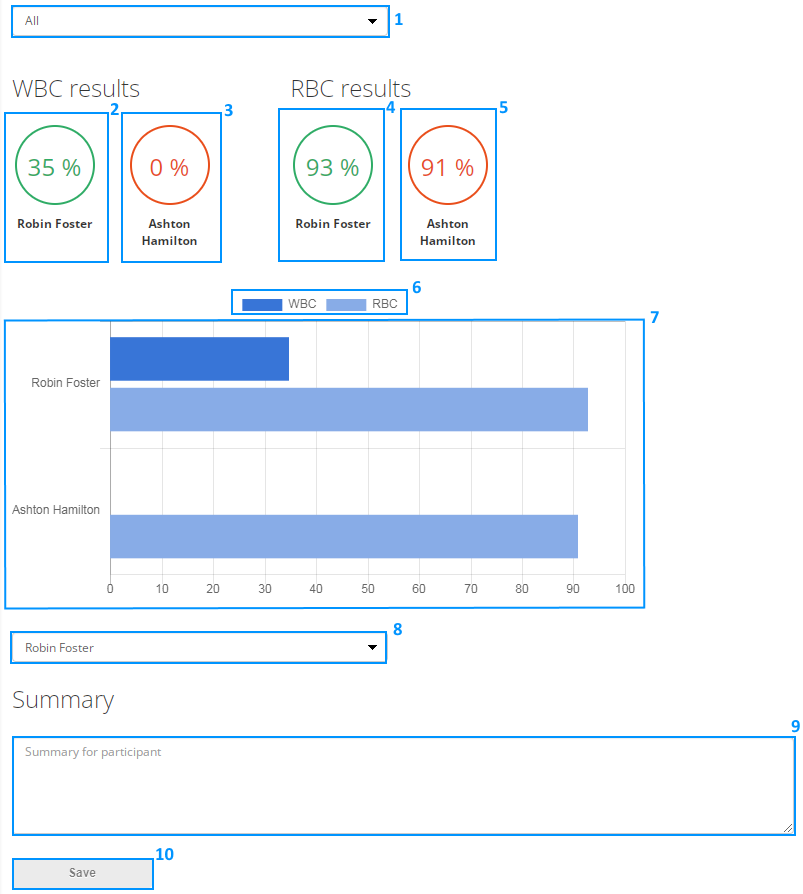
This tab displays basic information about the test:
- Drop-down list (1), where you can select a specific sample or all samples;
- Best and worst result for WBC (2, 3);
- Best and worst result for RBC (4, 5);
- Legend (6);
- Diagram (7);
- Drop-down list with participants for writing a summary based on the test results (8);
- Text field for the summary (9);
- "Save" button (10).
To write a summary, select a participant in the drop-down list (8), write the summary in the text field (9) and click "Save". A notification will be sent to the participant's email address. When the participant reads the summary, you will receive a corresponding email, and a "Viewed" notification will appear to the right of the "Save" button.
When you select a sample in the drop-down list (1), the description of the interpretation is displayed under the diagram.
"Types" tab
Select "Types" in the report switching panel. This tab displays the table with the results of cell type identification.
The results can be viewed in different ways depending on the combination of choices in the drop-down lists. The first drop-down list defines the sample, the second one defines the participant and the third one defines the cell type.
Results for all participants and a specific cell type of a sample.
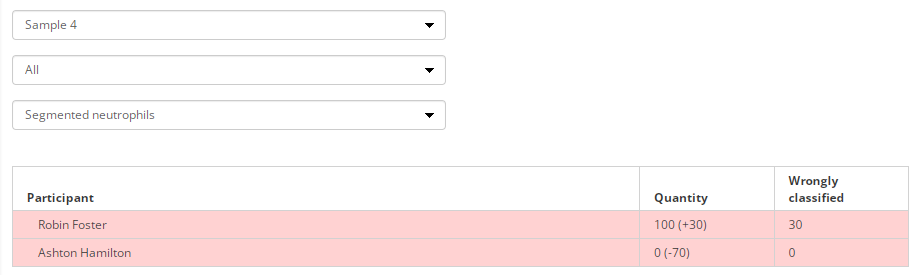
Select a sample in the first drop-down list, select "All" in the second list, and select a cell type in the third one.
Result for a specific participant and all cell types of a sample.
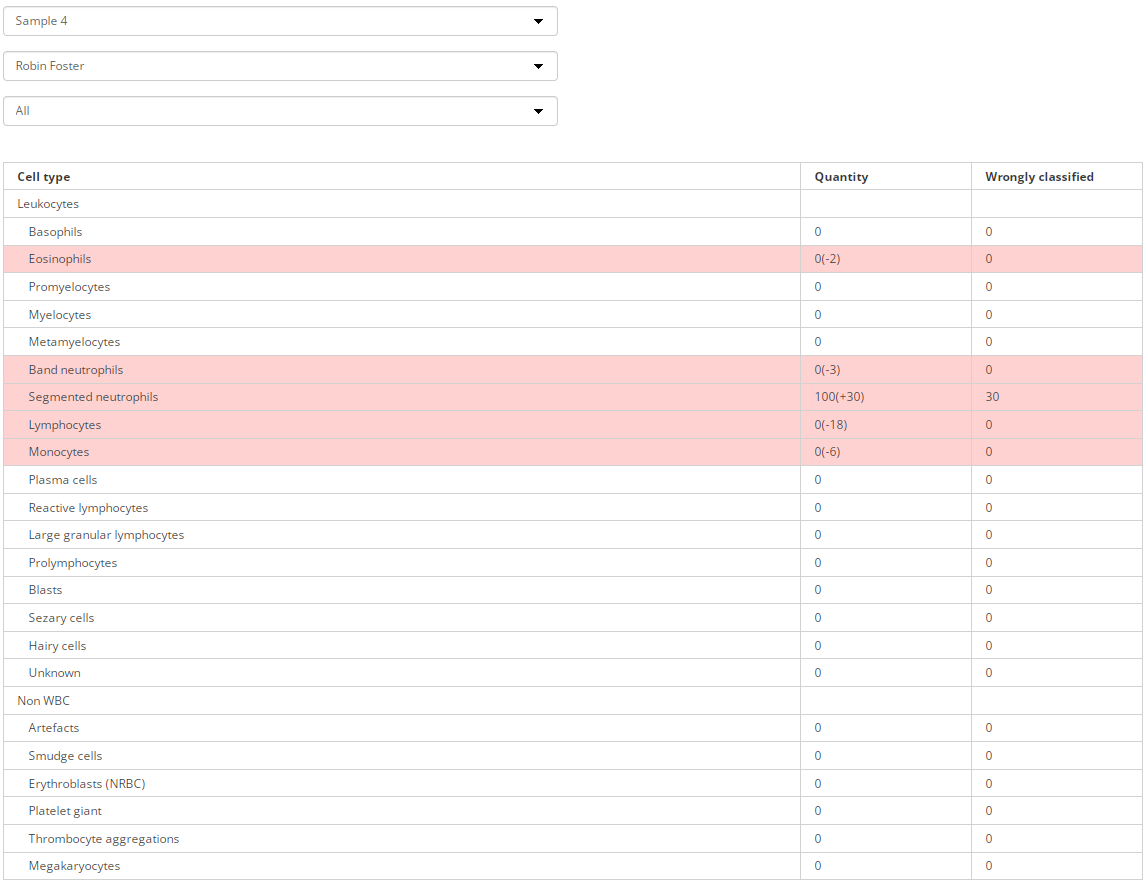
Select a sample in the first drop-down list, select a participant in the second list, and select "All" in the third one.
“Cells” tab
Select "Cells" in the report switching panel. This tab displays a gallery of misclassified cells.
The results can be viewed in different ways depending on the combination of choices in the drop-down lists. The first drop-down list defines the sample; the second one defines the participant.
Result for a specific participant and a specific sample
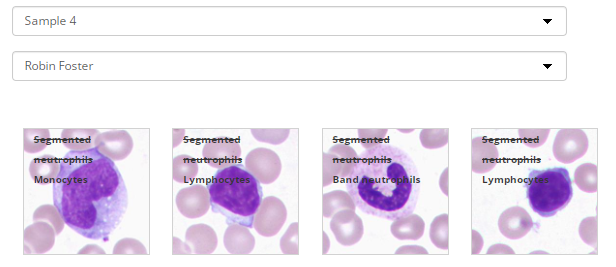
Select a sample in the first drop-down list and a participant in the second one.
Results for all participants and a specific sample
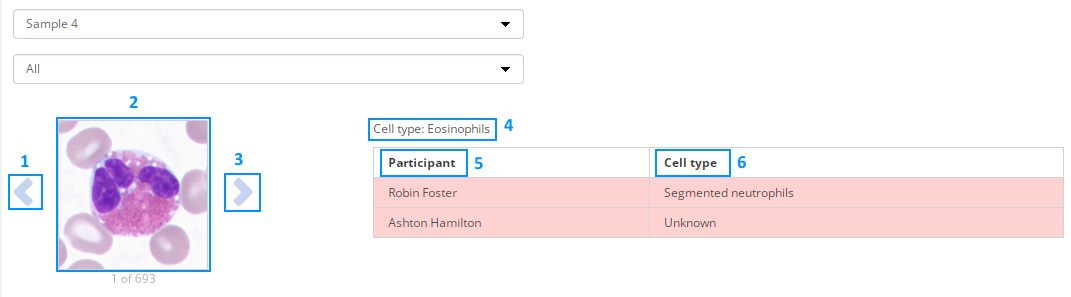
Select a sample in the first drop-down list and "All" in the second one. You will see the data for each individual cell (2).
Use the navigation buttons (1, 3) to check other cells.
The correct cell type (4) is indicated above the table. The results table consists of two columns:
- Participant (5);
- Cell type (6) selected by the participant.
Incorrect cell types are highlighted in color.
“RBC” tab
Select "RBC" in the report switching panel. This tab displays a table with the results of determining the parameters of red blood cells, and the images of the sample.
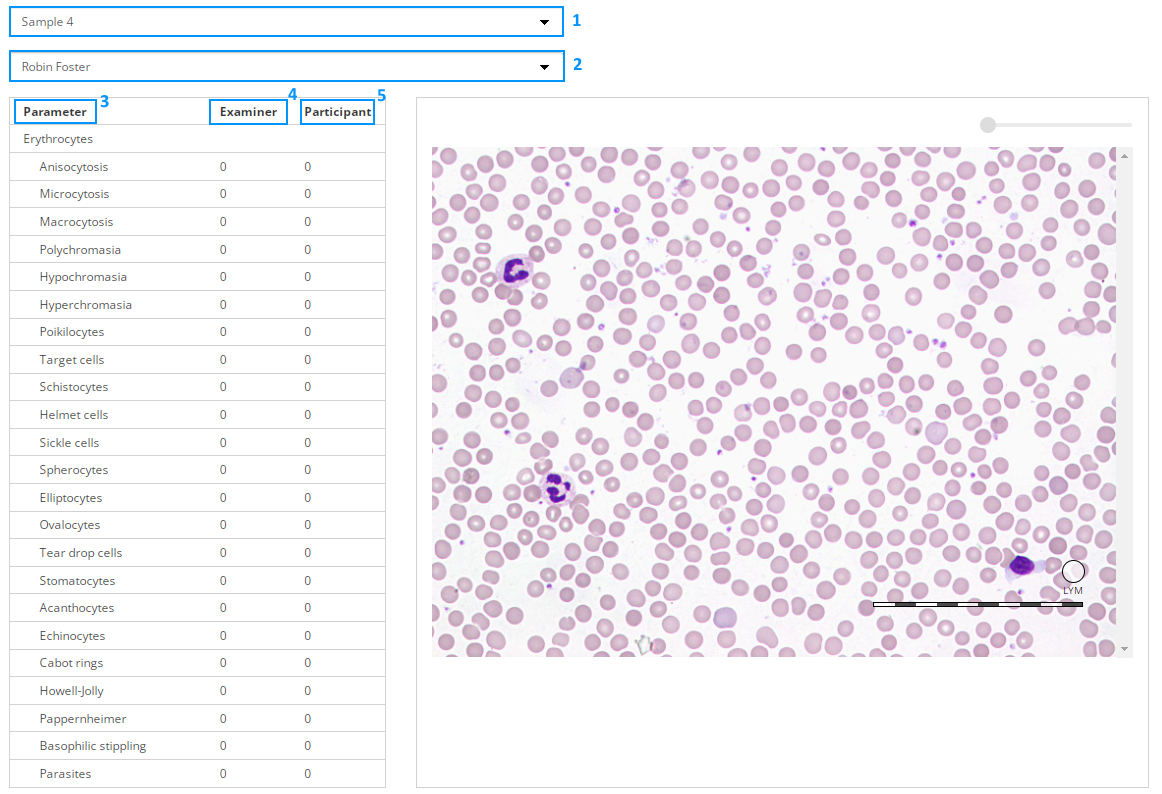
Select a sample and a participant in the drop-down lists (1) and (2) respectively. The results table consists of the following columns:
- "Parameter" (3);
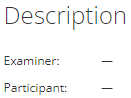
- "Examiner" (4) — correct answer;
- "Participant" (5) — participant's answer.
The rows errors are highlighted in color.
Viewing test results for BM samples
The report switching panel consists of 3 tabs: "General", "Types", "Cells".
"General" tab
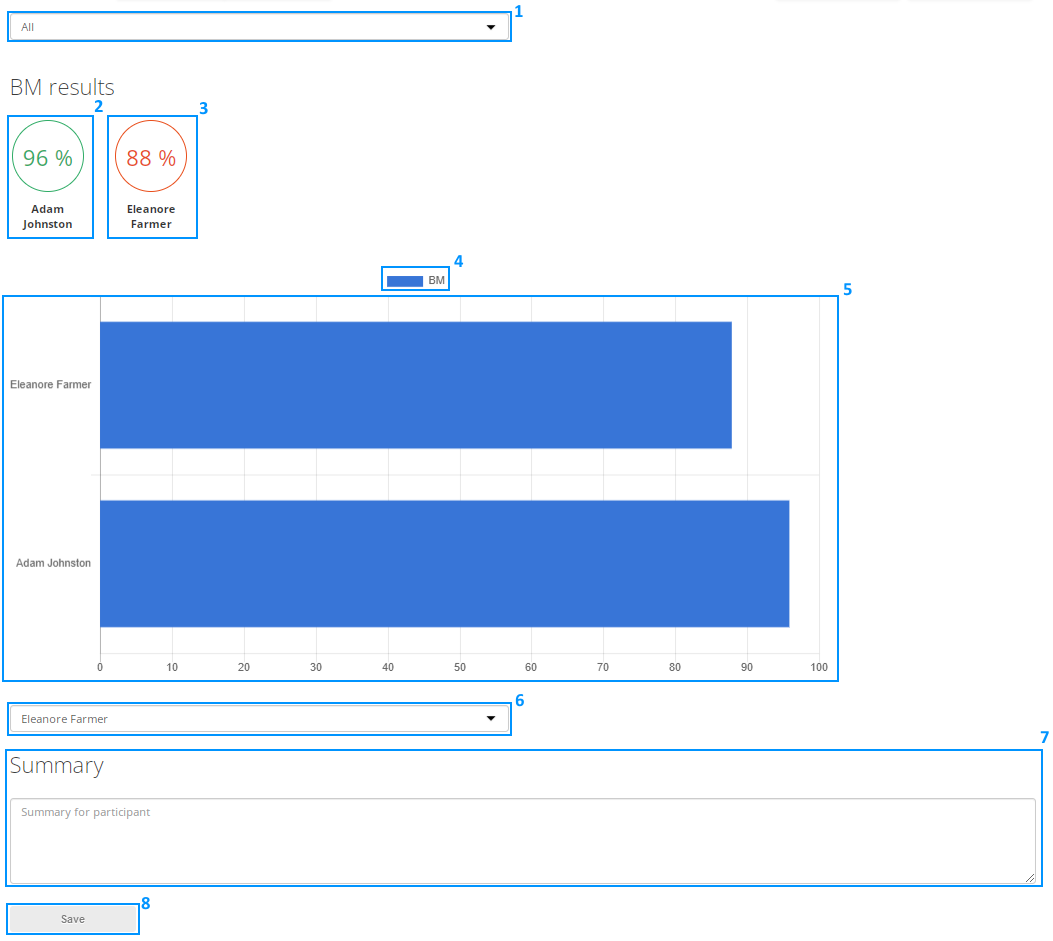
This tab displays basic information about the test:
- Drop-down list (1), where you can select a specific sample or all samples;
- Best and worst results (2, 3);
- Legend (4);
- Diagram (5);
- Drop-down list with participants for writing a summary based on the test results (6);
- Text field for the summary (7);
- "Save" button (8).
To write a summary, select a participant in the drop-down list (6), write the summary in the text field (7) and click "Save". A notification will be sent to the participant's email address. When the participant reads the summary, you will receive a corresponding email, and a "Viewed" notification will appear to the right of the "Save" button.
When you select a sample in the drop-down list (1), the description of the interpretation is displayed under the diagram.
"Types" tab
Select "Types" in the report switching panel. This tab displays a table with the results of cell type identification.
The results can be viewed in different ways depending on the combination of choices in the drop-down lists. The first drop-down list defines the sample, the second one defines the participant and the third one defines the cell type.
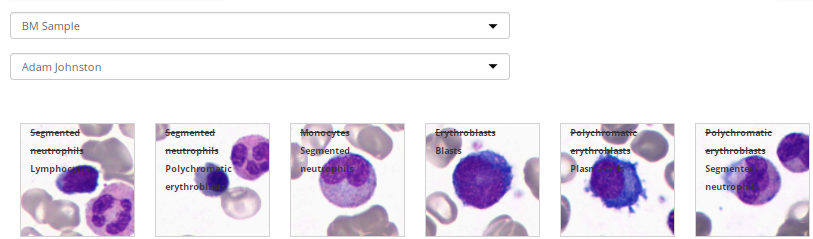
Results for all participants and a specific cell type for a sample
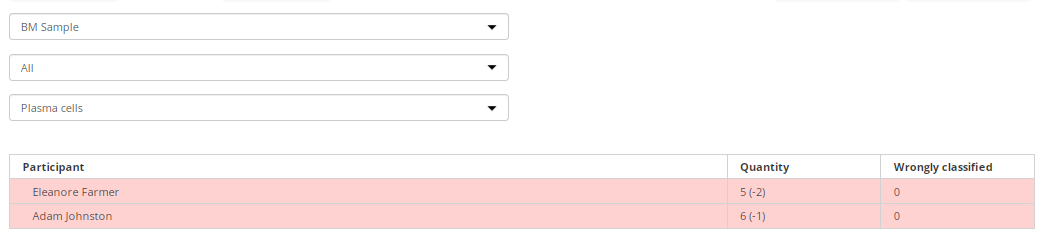
Select a sample in the first drop-down list, select "All" in the second list, and select a cell type in the third one.
Result for a specific participant and all cell types of a sample
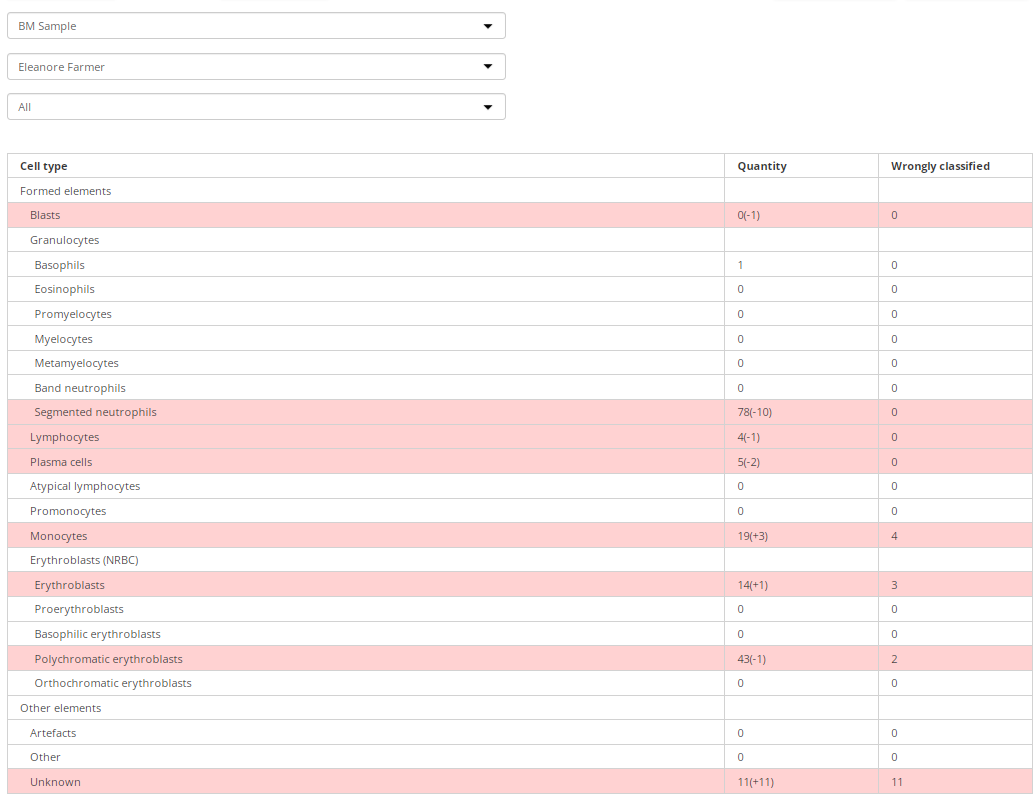
Select a sample in the first drop-down list, select a participant in the second list, and select "All" in the third one.
"Cells" tab
Select "Cells" in the report switching panel. This tab displays a gallery of misclassified cells.
The results can be viewed in different ways depending on the combination of choices in the drop-down lists. The first drop-down list defines the sample; the second one defines the participant.
Result for a specific participant and a specific sample
Select a sample in the first drop-down list and a participant in the second one.
Results for all participants and a specific sample
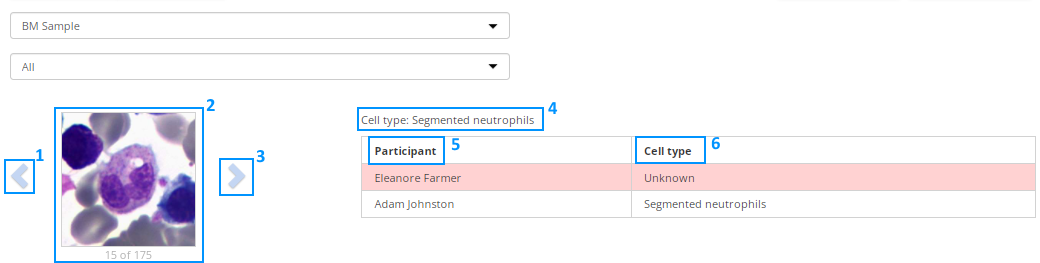
Select a sample in the first drop-down list and "All" in the second one. You will see the data for each individual cell (2).
Use the navigation buttons (1, 3) to check other cells.
The correct cell type (4) is indicated above the table. The results table consists of two columns:
- Participant (5);
- Cell type (6) selected by the participant;
Incorrect cell types are highlighted in color.
Viewing test results for Pap and Pap ICC samples
The report switching panel consists of 4 tabs: "General", "Types", "Cells", "Interpretation".
"General" tab
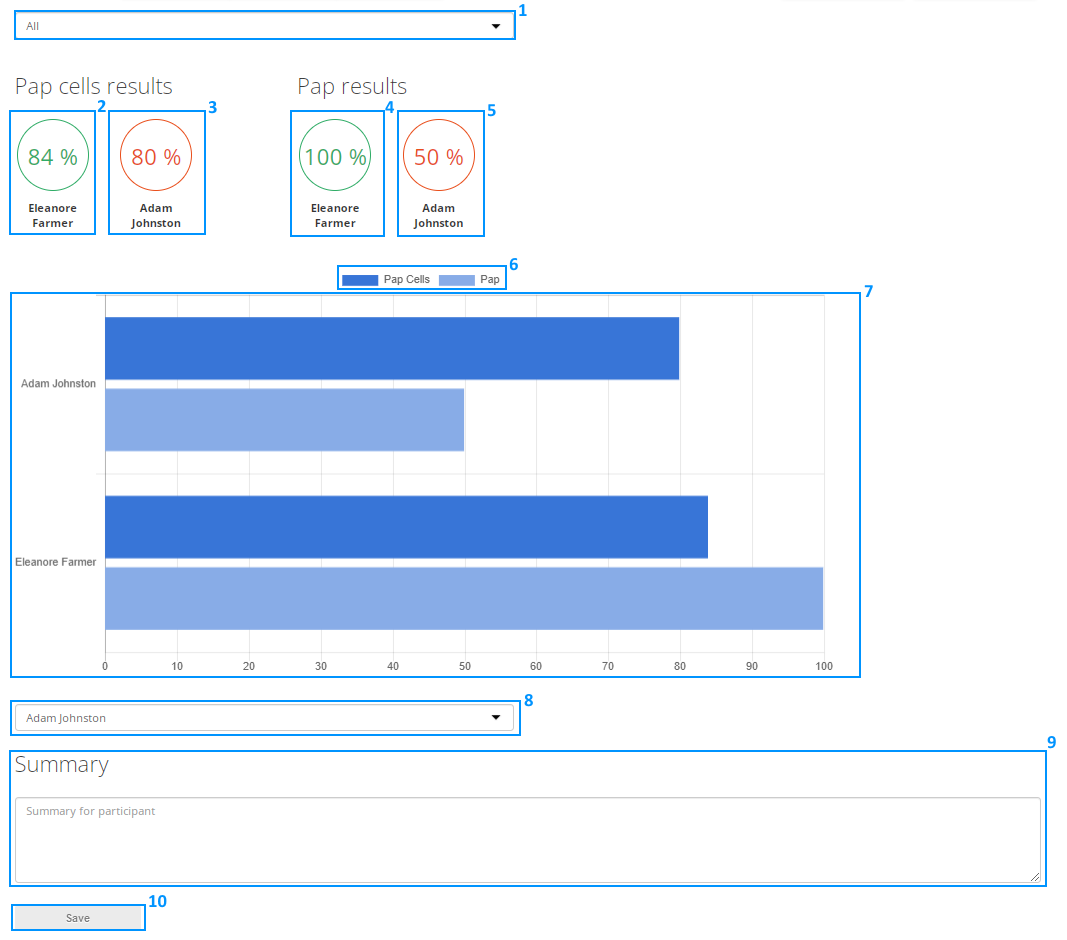
This tab displays basic information about the test:
- Drop-down list (1), where you can select a specific sample or all samples;
- Best and worst results for identification of cells (2, 3);
- Best and worst results for choosing the interpretation (4, 5);
- Legend (6);
- Diagram (7);
- Drop-down list with participants for writing a summary based on the test results (8);
- Text field for the summary (9);
- "Save" button (10).
To write a summary, select a participant in the drop-down list (8), write the summary in the text field (9) and click "Save". A notification will be sent to the participant's email address. When the participant reads the summary, you will receive a corresponding email, and a "Viewed" notification will appear to the right of the "Save" button.
When you select a sample in the drop-down list (1), the description of the interpretation is displayed under the diagram.
"Types" tab
Select "Types" in the report switching panel. This tab displays a table with the results of cell type identification.
The results can be viewed in different ways depending on the combination of choices in the drop-down lists. The first drop-down list defines the sample, the second one defines the participant and the third one defines the cell type.
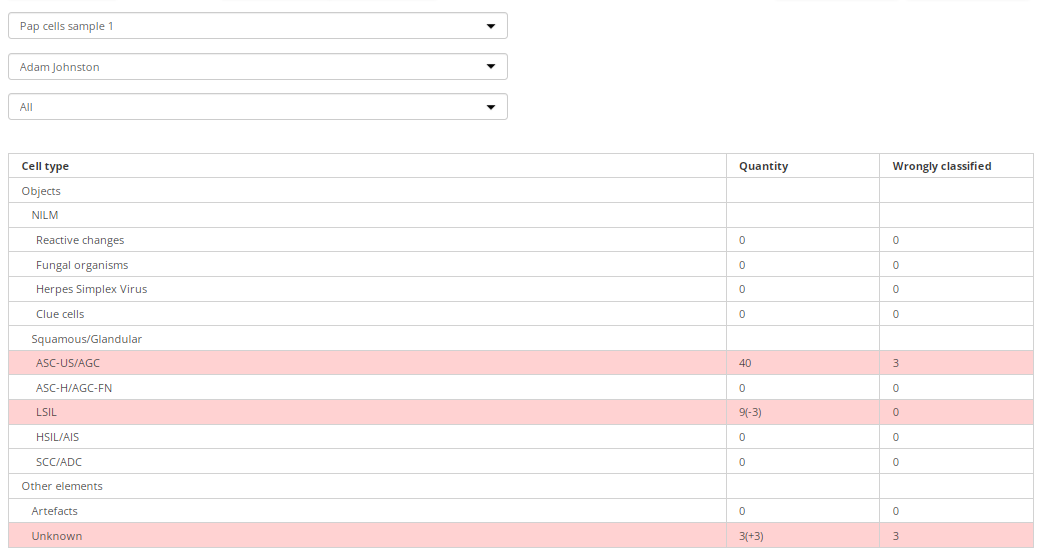
Results for all participants and a specific cell type for a sample
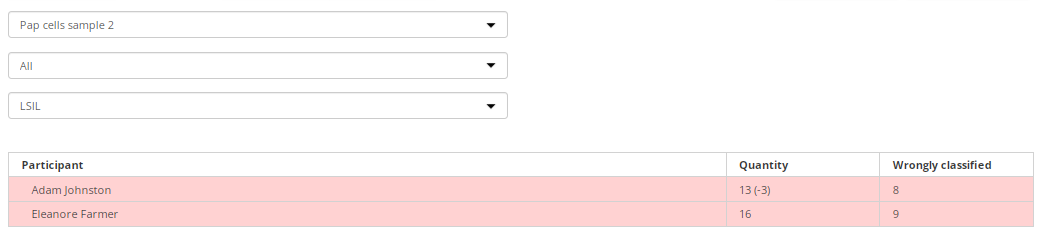
Select a sample in the first drop-down list, select "All" in the second list, and select a cell type in the third one.
Result for a specific participant and all cell types of a sample
Select a specific sample in the first drop-down list, select a participant in the second list, and select "All" in the third one.
“Cells” tab
Select "Cells" in the report switching panel. This tab displays a gallery of misclassified cells.
The results can be viewed in different ways depending on the combination of choices in the drop-down lists. The first drop-down list defines the sample; the second one defines the participant.
Result for a specific participant and a specific sample
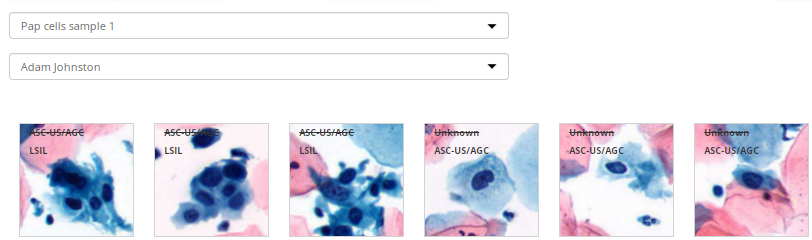
Select a sample in the first drop-down list and a participant in the second one.
Results for all participants and a specific sample
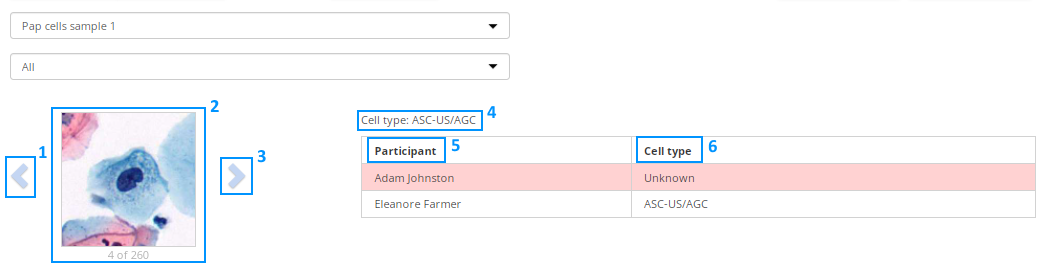
Select a sample in the first drop-down list and "All" in the second one. You will see the data for each individual cell (2).
Use the navigation buttons (1, 3) to check other cells.
The correct cell type (4) is indicated above the table. The results table consists of two columns:
- Participant (5);
- Cell type (6) selected by the participant;
Incorrect cell types are highlighted in color.
“Interpretation" tab
Select "Interpretation" in the report switching panel. This tab displays a table with the results of choosing the interpretation.
The results can be viewed in different ways depending on the combination of choices in the drop-down lists. The first drop-down list defines the sample; the second one defines the participant.
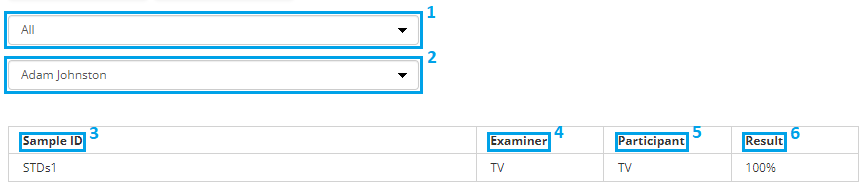
Results for a specific participant and all samples
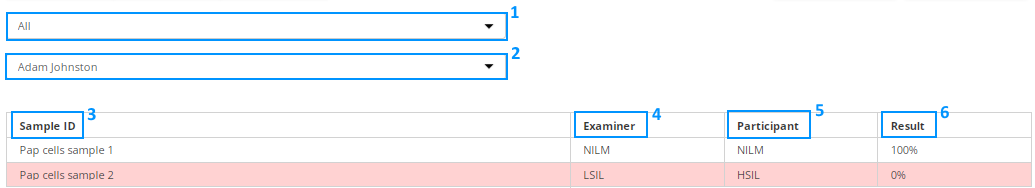
Select "All" in the drop-down list (1) and a participant in the drop-down list (2).
The results table contains the following:
- "Sample ID" (3);
- "Examiner" (4) — correct answer;
- "Participant" (5) — participant's answer;
- "Result" (6) — percentage of correct answers for a specific sample;
The rows with errors are highlighted in color.
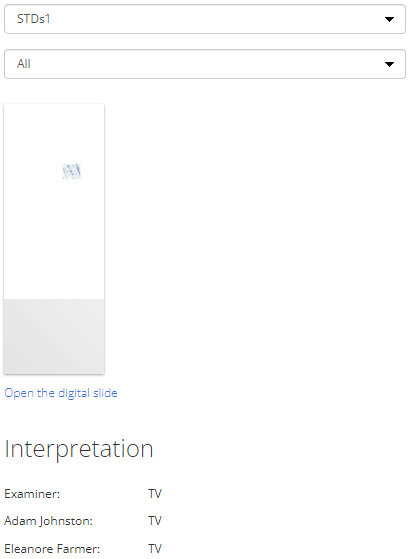
Results for a specific sample and all participants
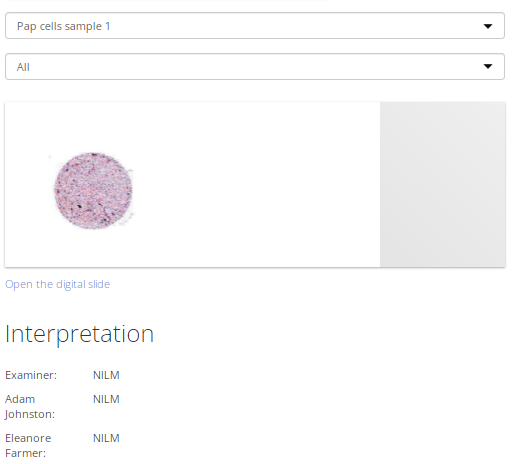
Select a sample in the first drop-down list. Select "All" in the second drop-down list.
The page contains an image of a digital slide and the "Interpretation" list. The "Interpretation" list displays the interpretation set by the examiner (the correct answer), and the interpretation set by the participants.
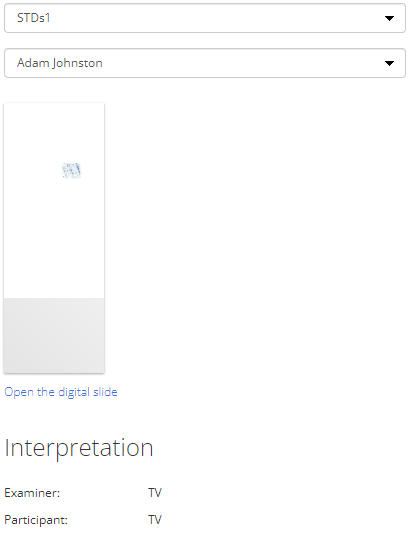
Result for a specific sample and a specific participant
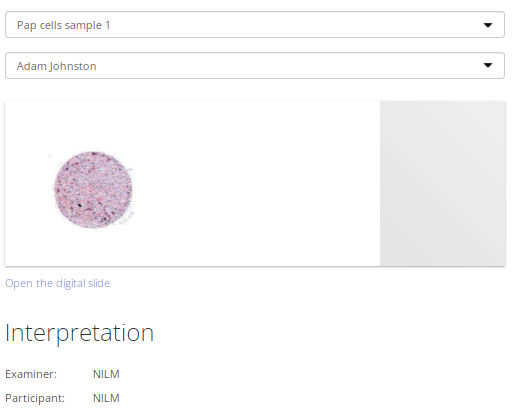
Select a sample in the first drop-down list and a participant in the second one.
The page contains an image of a digital slide and the "Interpretation" list. The "Interpretation" list displays the interpretation set by the examiner (the correct answer), and the interpretation set by the selected participant.
Viewing test results for BF samples
The report switching panel consists of 3 tabs: "General", "Types", "Cells".
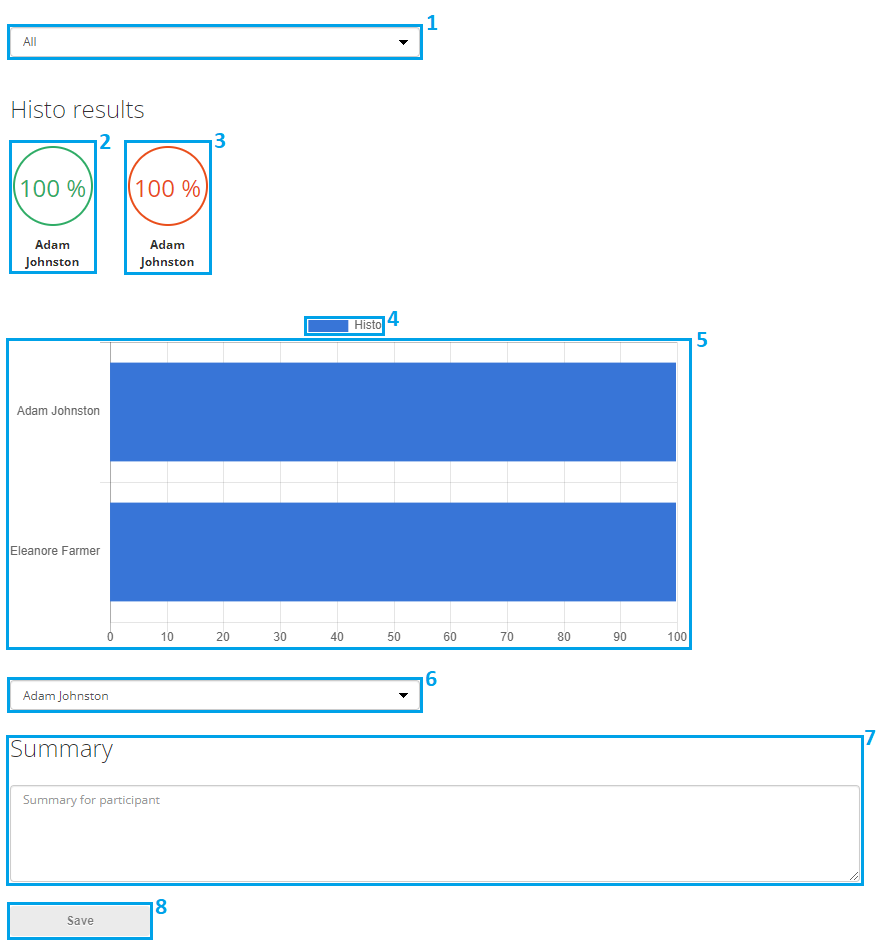
“General” tab
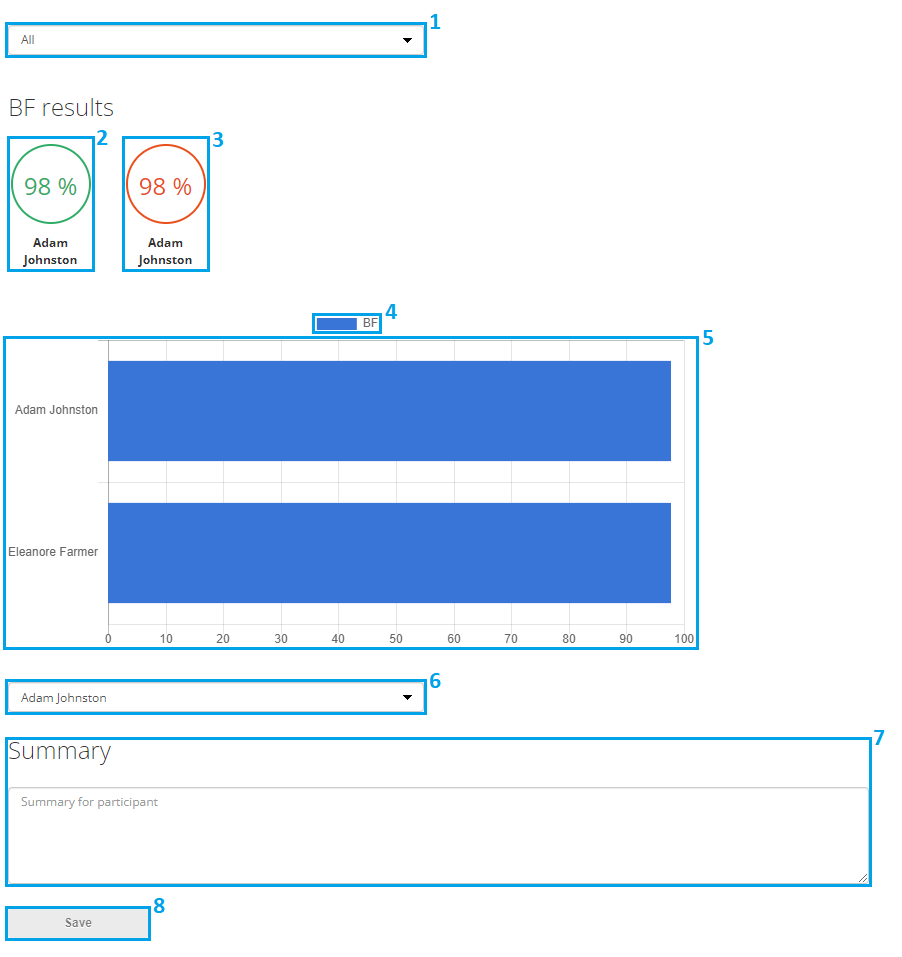
This tab displays basic information about the test:
- Drop-down list (1), where you can select a specific sample or all samples;
- Best and worst results for identification of cells (2, 3);
- Legend (4);
- Diagram (5);
- Drop-down list with participants for writing a summary based on the test results (6);
- Text field for the summary (7);
- "Save" button (8).
To write a summary, select a participant in the drop-down list (6), write the summary in the text field (7) and click "Save". A notification will be sent to the participant's email address. When the participant reads the summary, you will receive a corresponding email, and a "Viewed" notification will appear to the right of the "Save" button.
When you select a sample in the drop-down list (1), the description of the interpretation is displayed under the diagram.
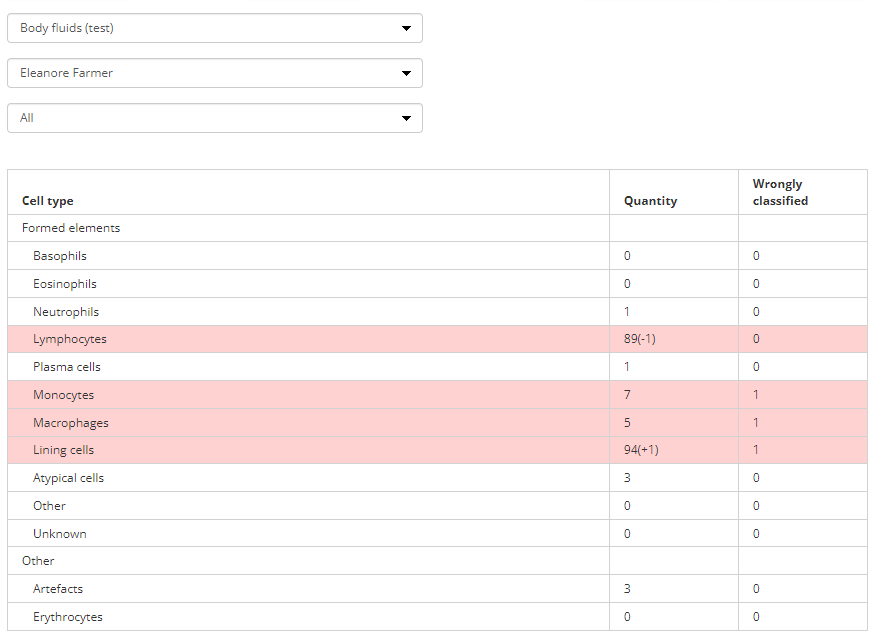
"Types" tab
Select «Types» in the report switching panel. This tab displays a table with the results of cell type identification.
The results can be viewed in different ways depending on the combination of choices in the drop-down lists. The first drop-down list defines the sample, the second one defines the participant and the third one defines the cell type.
Results for all participants and a specific cell type for a sample
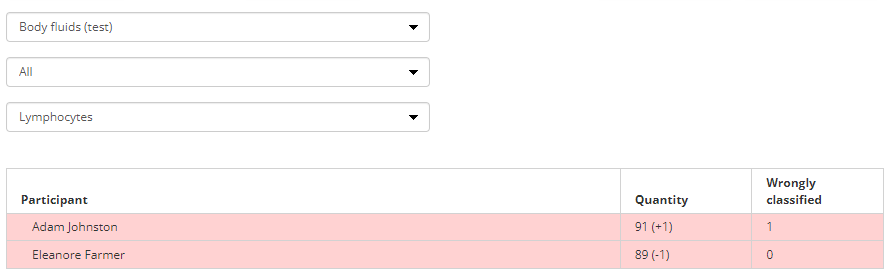
Select a sample in the first drop-down list, select "All" in the second list, and select a cell type in the third one.
Result for a specific participant and all cell types of a sample
Select a sample in the first drop-down list, select a participant in the second list, and select "All" in the third one.
“Cells” tab
Select "Cells" in the report switching panel. This tab displays a gallery of misclassified cells.
The results can be viewed in different ways depending on the combination of choices in the drop-down lists. The first drop-down list defines the sample; the second one defines the participant.
Result for a specific participant and a specific sample
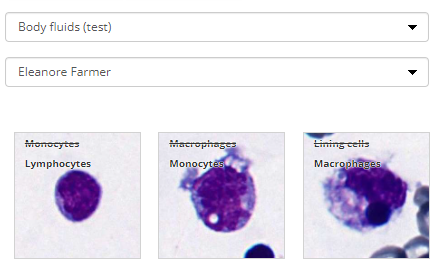
Select a sample in the first drop-down list and a participant in the second one.
Results for all participants and a specific sample
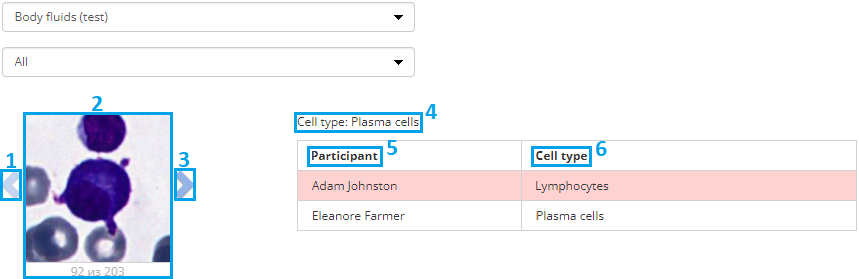
Select a sample in the first drop-down list and "All" in the second one. You will see the data for each individual cell (2).
Use the navigation buttons (1, 3) to check other cells.
The correct cell type (4) is indicated above the table. The results table consists of two columns:
- Participant (5);
- Cell type (6) selected by the participant;
Incorrect cell types are highlighted in color.
Viewing test results for Histo and Cyto samples
The report switching panel consists of 2 tabs: "General" and "Interpretation".
“General” tab
This tab displays basic information about the test:
- Drop-down list (1), where you can select a specific sample or all samples;
- Best and worst results for choosing the interpretation (4, 5);
- Legend (4);
- Diagram (5);
- Drop-down list with participants for writing a summary based on the test results (6);
- Text field for the summary (7);
- "Save" button (8).
To write a summary, select a participant in the drop-down list (6), write the summary in the text field (7) and click "Save". A notification will be sent to the participant's email address. When the participant reads the summary, you will receive a corresponding email, and a "Viewed" notification will appear to the right of the "Save" button.
When you select a sample in the drop-down list (1), the description of the interpretation is displayed under the diagram.
“Interpretation” tab
Select "Interpretation" in the report switching panel. This tab displays a table with the results of choosing the interpretation.
The results can be viewed in different ways depending on the combination of choices in the drop-down lists. The first drop-down list defines the sample; the second one defines the participant.
Results for a specific participant and all samples
Select "All" in the drop-down list (1) and a participant in the drop-down list.
The results table contains the following:
- "Sample ID" (3);
- "Examiner" (4) — correct answer;
- "Participant" (5) — participant's answer;
- "Result" (6) — percentage of correct answers for a specific sample;
The rows with errors are highlighted in color.
Results for a specific sample and all participants
Select a sample in the first drop-down list. Select "All" in the second drop-down list.
The page contains an image of a digital slide and the "Interpretation" list. The "Interpretation" list displays the interpretation set by the examiner (the correct answer), and the interpretation set by the participants.
Result for a specific sample and a specific participant
Select a sample in the first drop-down list and a participant in the second one.
The page contains an image of a digital slide and the "Interpretation" list. The "Interpretation" list displays the interpretation set by the examiner (the correct answer), and the interpretation set by the selected participant.
Viewing test results for STDs samples
The report switching panel consists of 2 tabs: "General" and "Interpretation".
“General” tab
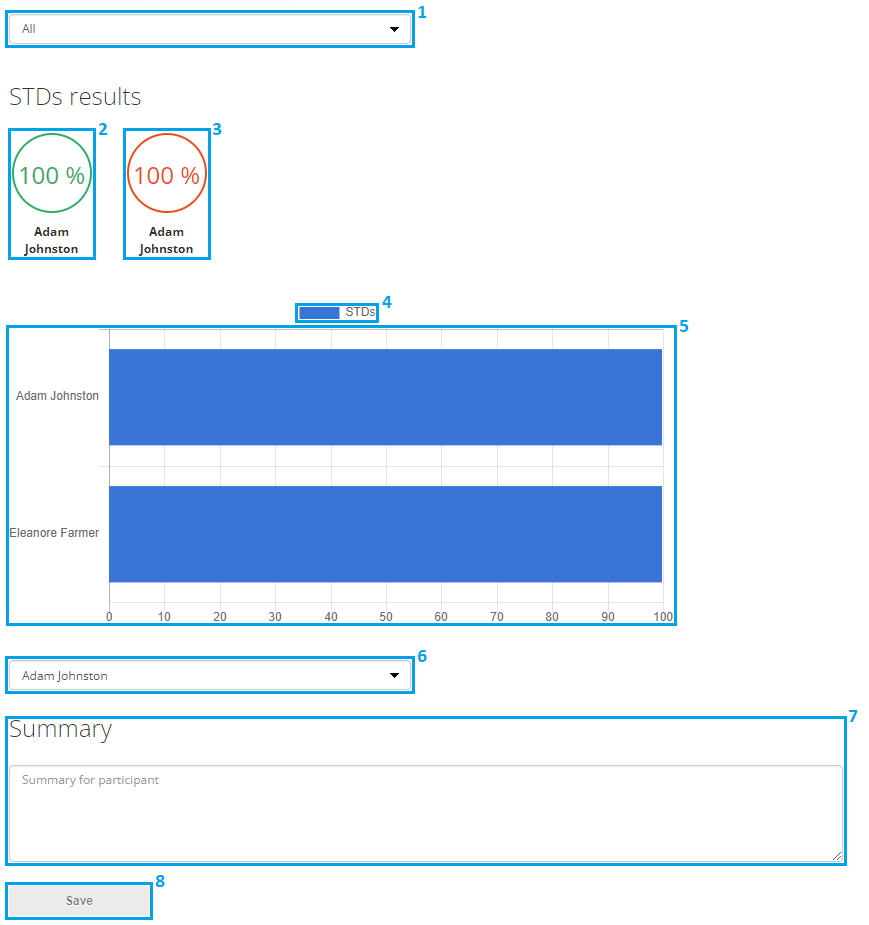
This tab displays basic information about the test:
- Drop-down list (1), where you can select a specific sample or all samples;
- Best and worst results for choosing the interpretation (4, 5);
- Legend (4);
- Diagram (5);
- Drop-down list with participants for writing a summary based on the test results (6);
- Text field for the summary (7);
- "Save" button (8).
To write a summary, select a participant in the drop-down list (6), write the summary in the text field (7) and click "Save". A notification will be sent to the participant's email address. When the participant reads the summary, you will receive a corresponding email, and a "Viewed" notification will appear to the right of the "Save" button.
When you select a sample in the drop-down list (1), the description of the interpretation is displayed under the diagram.
“Interpretation” tab
Select "Interpretation" in the report switching panel. This tab displays a table with the results of choosing the interpretation.
The results can be viewed in different ways depending on the combination of choices in the drop-down lists. The first drop-down list defines the sample; the second one defines the participant.
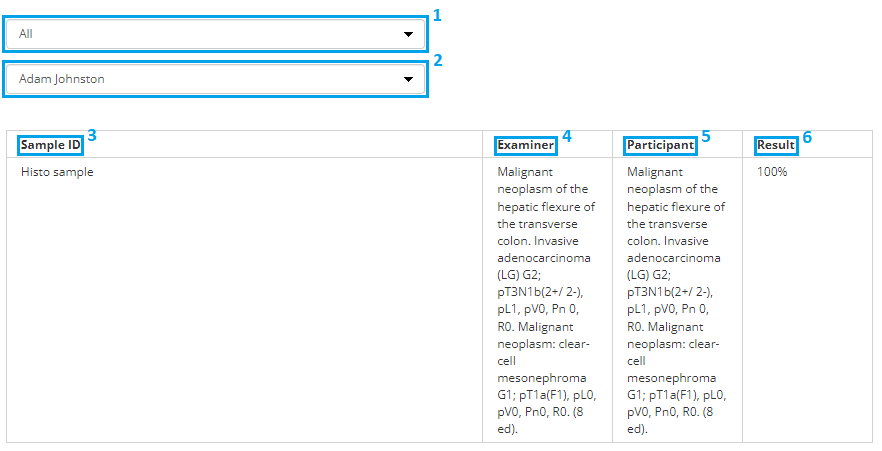
Results for a specific participant and all samples
Select "All" in the drop-down list (1) and a participant in the drop-down list.
The results table contains the following:
- "Sample ID" (3);
- "Examiner" (4) — correct answer;
- "Participant" (5) — participant's answer;
- "Result" (6) — percentage of correct answers for a specific sample;
The rows with errors are highlighted in color.
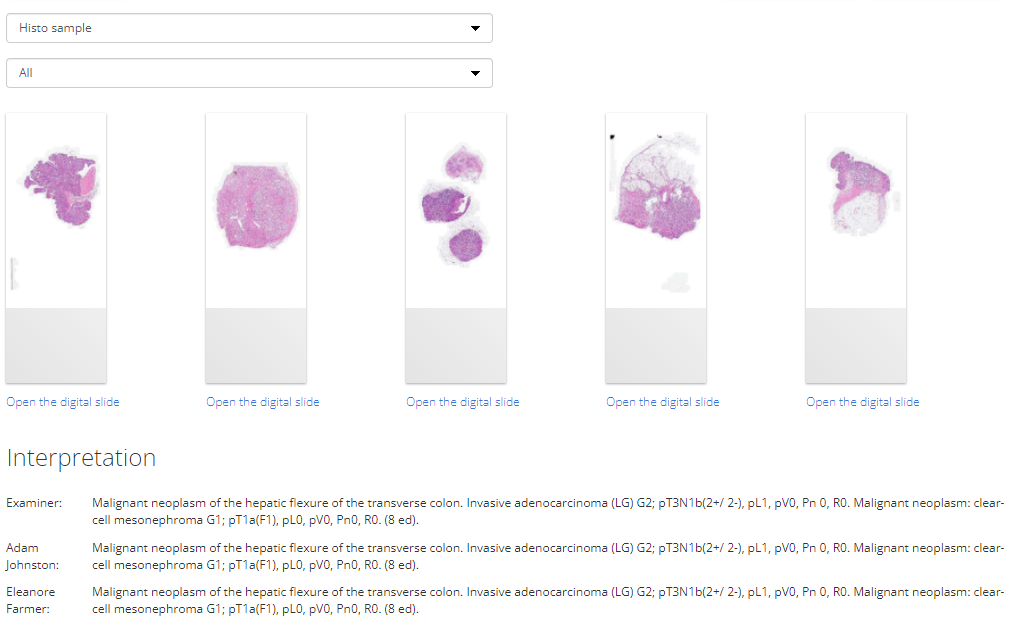
Results for a specific sample and all participants
Select a sample in the first drop-down list. Select "All" in the second drop-down list.
The page contains an image of a digital slide and the "Interpretation" list. The "Interpretation" list displays the interpretation set by the examiner (the correct answer), and the interpretation set by the participants.
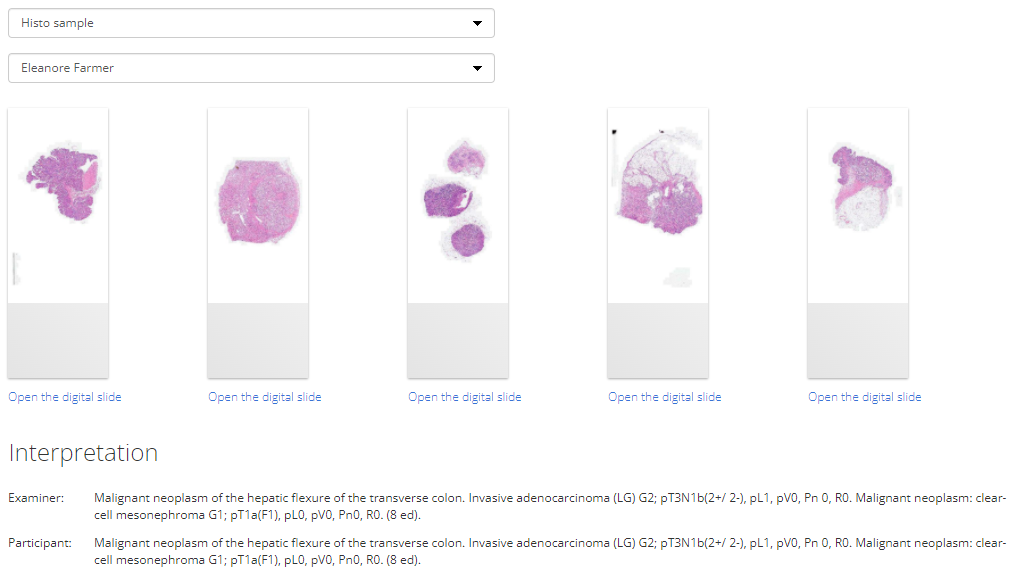
Result for a specific sample and a specific participant
Select a sample in the first drop-down list and a participant in the second one.
The page contains an image of a digital slide and the "Interpretation" list. The "Interpretation" list displays the interpretation set by the examiner (the correct answer), and the interpretation set by the selected participant.
Viewing test results for Microbiology samples
The report switching panel consists of 2 tabs: "General" and "Flags".
“General” tab
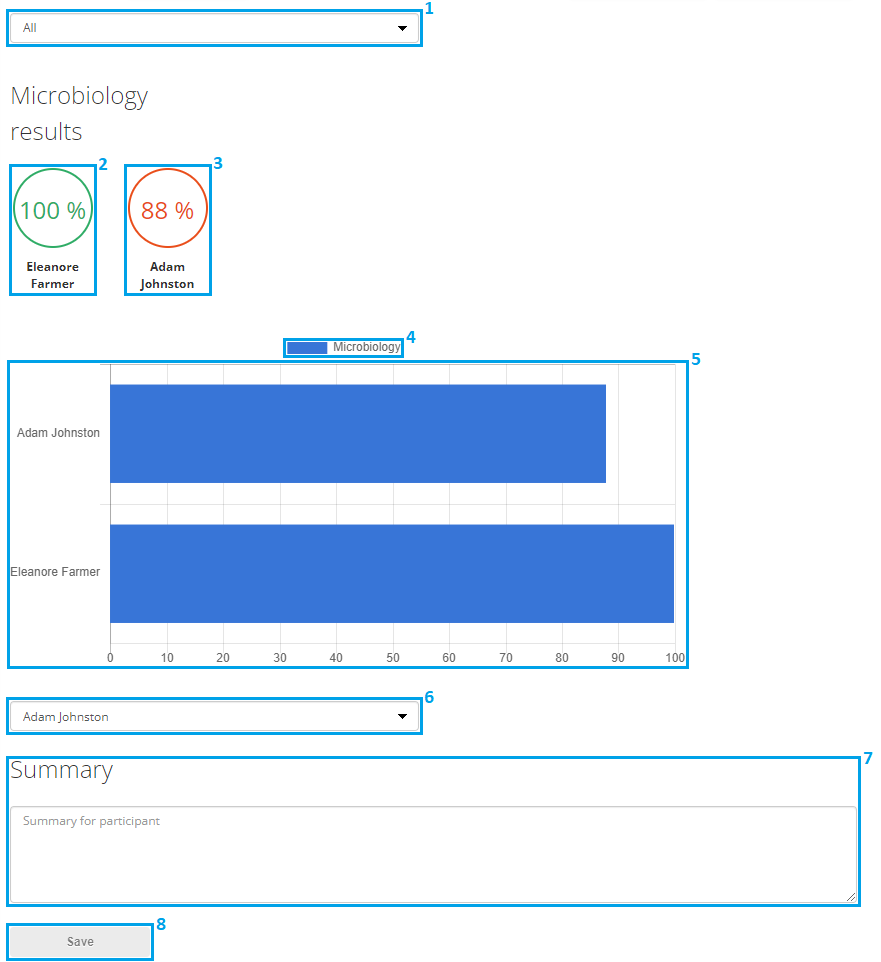
This tab displays basic information about the test:
- Drop-down list (1), where you can select a specific sample or all samples;
- Best and worst results for determining parameters (2, 3);
- Legend (4);
- Diagram (5);
- Drop-down list with participants for writing a summary based on the test results (6);
- Text field for the summary (7);
- "Save" button (8).
To write a summary, select a participant in the drop-down list (6), write the summary in the text field (7) and click "Save". A notification will be sent to the participant's email address. When the participant reads the summary, you will receive a corresponding email, and a "Viewed" notification will appear to the right of the "Save" button.
When you select a sample in the drop-down list (1), the description of the interpretation is displayed under the diagram.
“Flags” tab
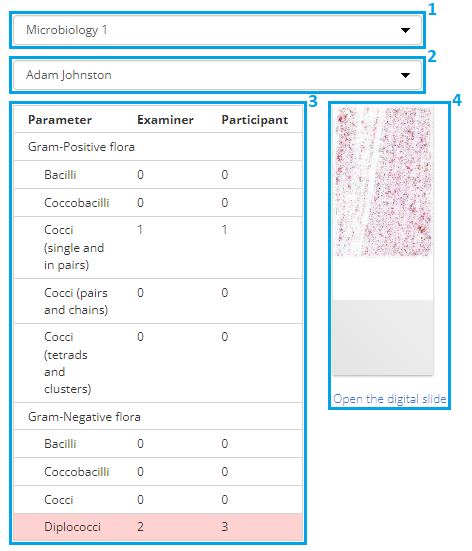
To see the results, select a sample in the first drop-down list (1) and a participant in the second one (2).
This tab displays a table with the results of determining the parameters (3) and the image of the digital slide with a link (4).
The table consists of the following columns:
- Parameter;
- Examiner — correct answer;
- You — your answer.
The rows errors are highlighted in color.
Clicking on the image of the digital slide or the "Open the digital slide" link will take you to a new page with a detailed overview of the digital slide.