Viewing test results
Select a completed test with the "Finished" status in the table with by clicking on it to view the test report.

The report switching panel (1), the "PDF report" button (2), and the contents of the specific tab of the report switching panel will appear under the table. The set of buttons on the report switching panel depends on the types of samples included in the test.
To view the report in PDF format, click the "PDF report" button.

The report will open in a new browser window and will also be sent to your email as an attachment. If the report does not open in a new window, you must allow pop-ups for this site in the browser settings. You can save the report from the browser window or download it from the received email.
Viewing test reports for CBC samples
The report switching panel consists of 4 tabs: "General", "Types", "Cells", "RBC".
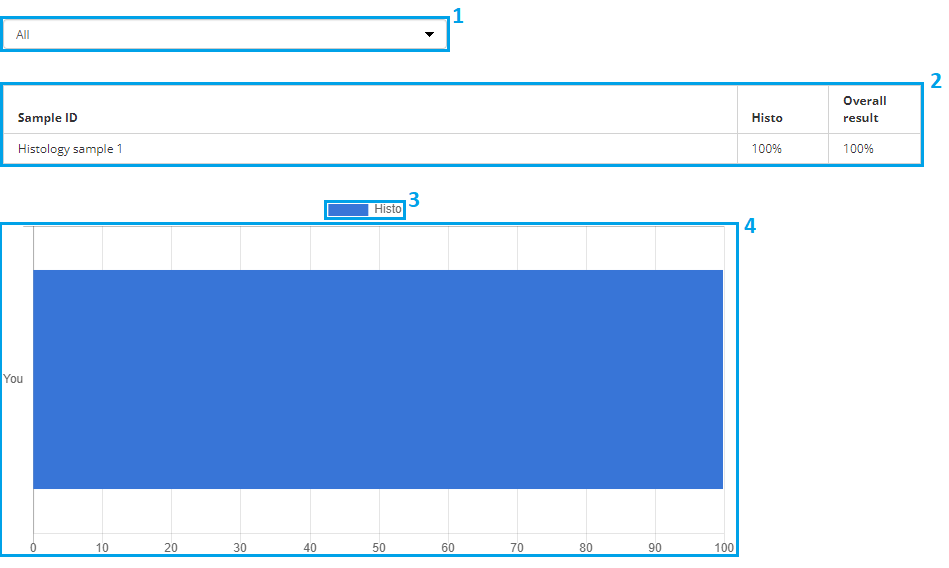
“General” tab
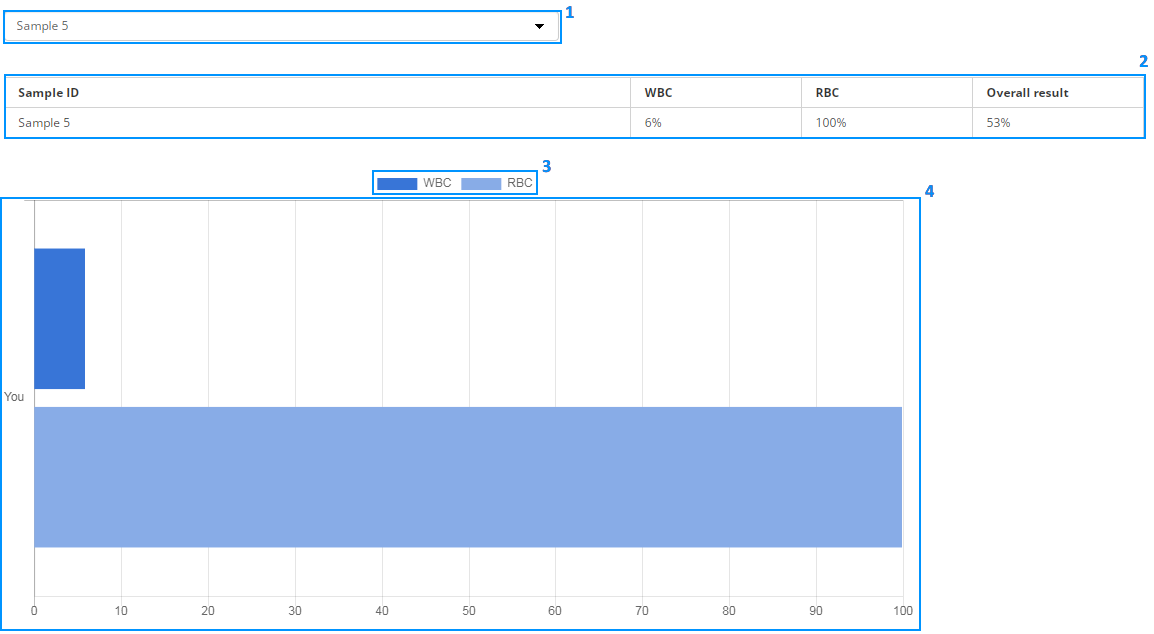
This tab displays basic information about the test.
- Drop-down list (1), where you can select a specific sample or all samples;
- Table with results for all samples in percentage points (2);
- Legend (3);
- Diagram (4).

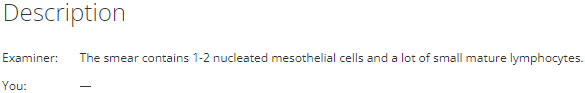
When you select a specific sample in the drop-down list (1), the description of the interpretation is displayed under the diagram.
"Types" tab
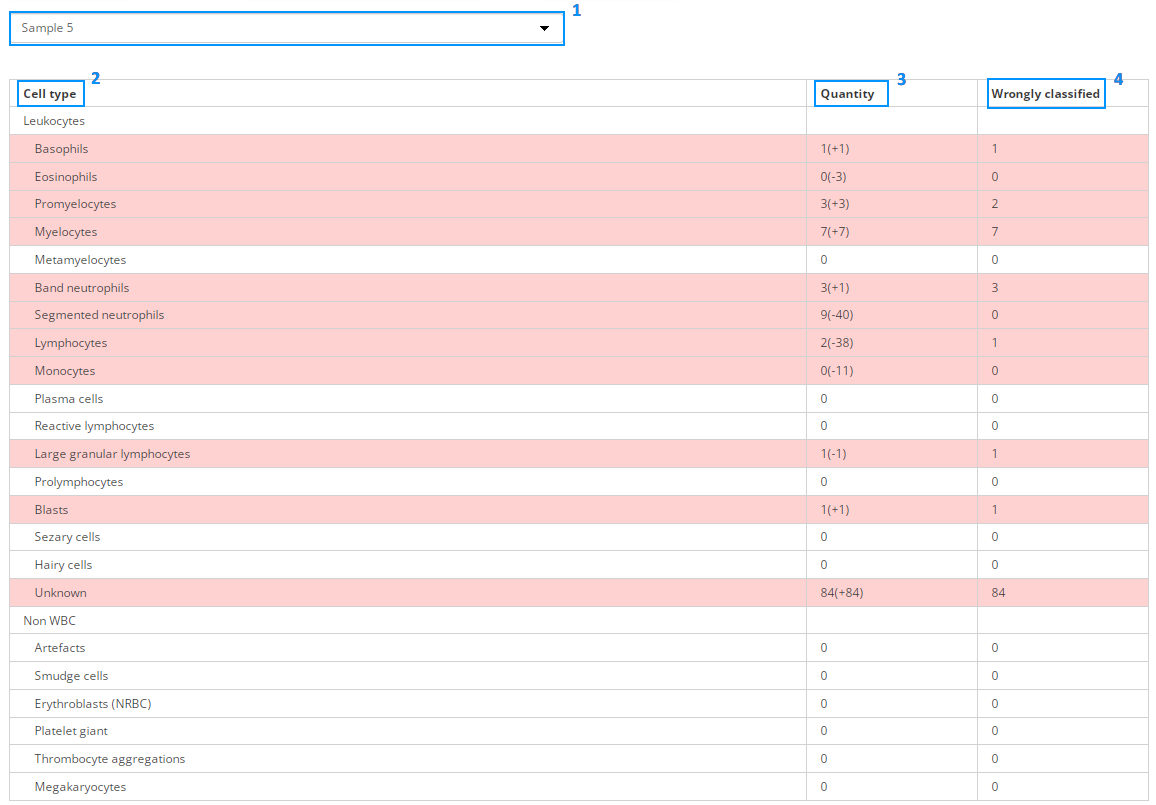
This tab displays a table with the results of cell identification for the sample selected in the drop-down list (1).
The table consists of three columns:
- Cell type (2);
- The number of cells of a specific type in the "A (B)" format , where A is the number of cells you selected, B is the number of missing and excessive cells with the "–" and "+" signs, respectively (3);
- The number of wrongly classified cells (4).
The rows with errors are highlighted in color.
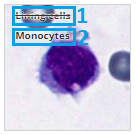
“Cells” tab
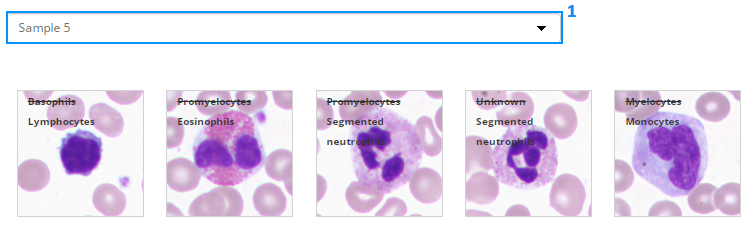
This tab displays a gallery of misclassified cells for the sample selected in the drop-down list (1).
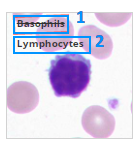
Each cell image displays the selected cell type (1) and the correct cell type (2)
“RBC” tab
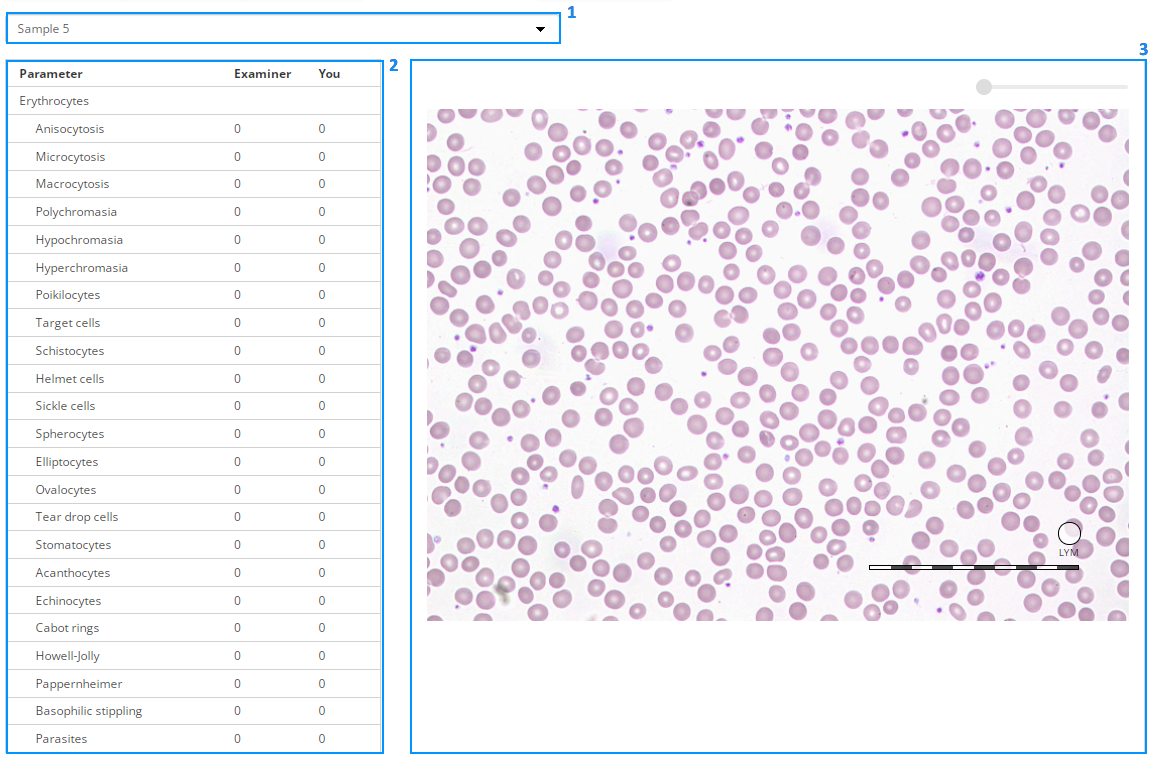
This tab displays a table with the results of determining the parameters of red blood cells (2) and the image of the sample (3), depending on the selection in the drop-down list (1).
The table consists of the following columns:
- Parameter;
- Examiner — correct answer;
- You — your answer.
The rows errors are highlighted in color.
Viewing test reports for BM samples
The report switching panel consists of 3 tabs: "General", "Types", "Cells".
"General" tab
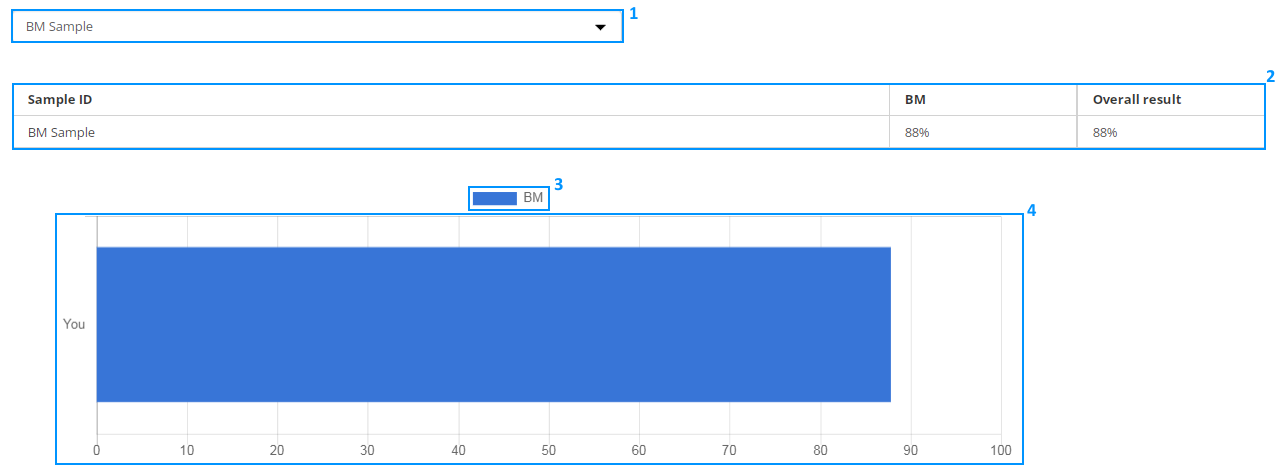
This tab displays basic information about the test.
- Drop-down list (1), where you can select a specific sample or all samples;
- Table with results for all samples in percentage points (2);
- Legend (3);
- Diagram (4).
When you select a specific sample in the drop-down list (1), the description of the interpretation is displayed under the diagram.
"Types" tab
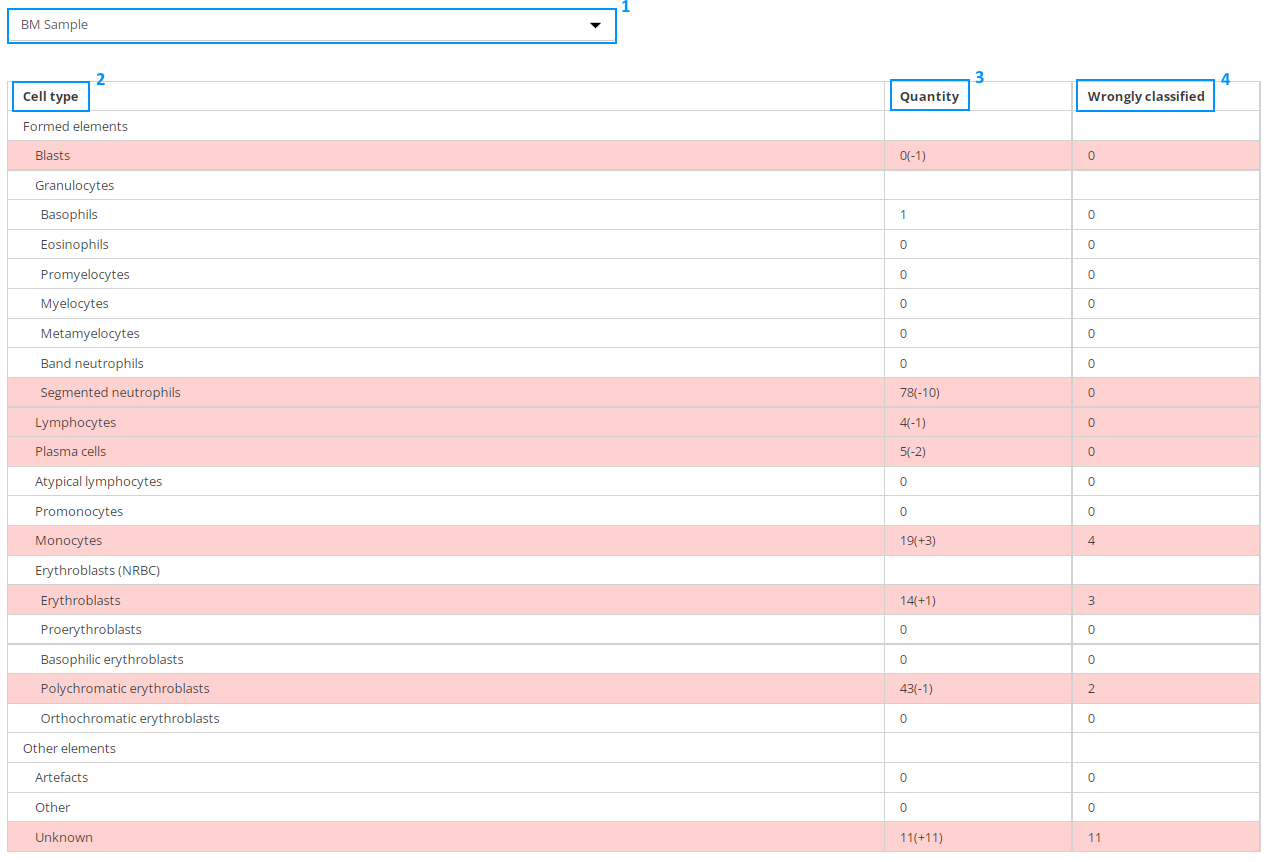
This tab displays a table with the results of cell identification for the sample selected in the drop-down list (1).
The table consists of three columns:
- Cell type (2);
- The number of cells of a specific type in the "A (B)" format , where A is the number of cells you selected, B is the number of missing and excessive cells with the "–" and "+" signs, respectively (3);
- The number of wrongly classified cells (4).
The rows errors are highlighted in color.
"Cells" tab
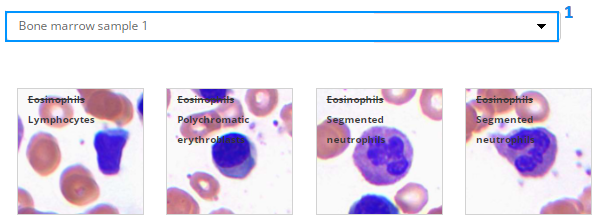
This tab displays a gallery of misclassified cells for the sample selected in the drop-down list (1).
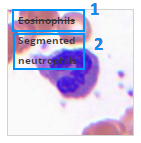
Each cell image displays the selected cell type (1) and the correct cell type (2).
Viewing test reports for Pap and Pap ICC samples
The report switching panel consists of 4 tabs: "General", "Types", "Cells", "Interpretation".
"General" tab
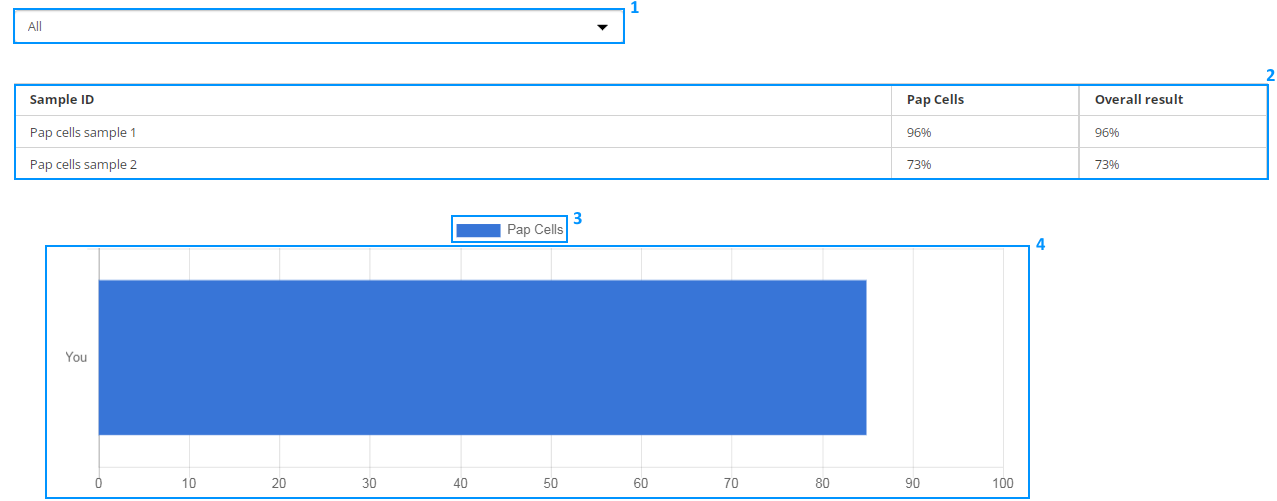
This tab displays basic information about the test.
- Drop-down list (1), where you can select a specific sample or all samples;
- Table with results for all samples in percentage points (2);
- Legend (3);
- Diagram (4).
When you select a specific sample in the drop-down list (1), the description of the interpretation is displayed under the diagram.
"Types" tab
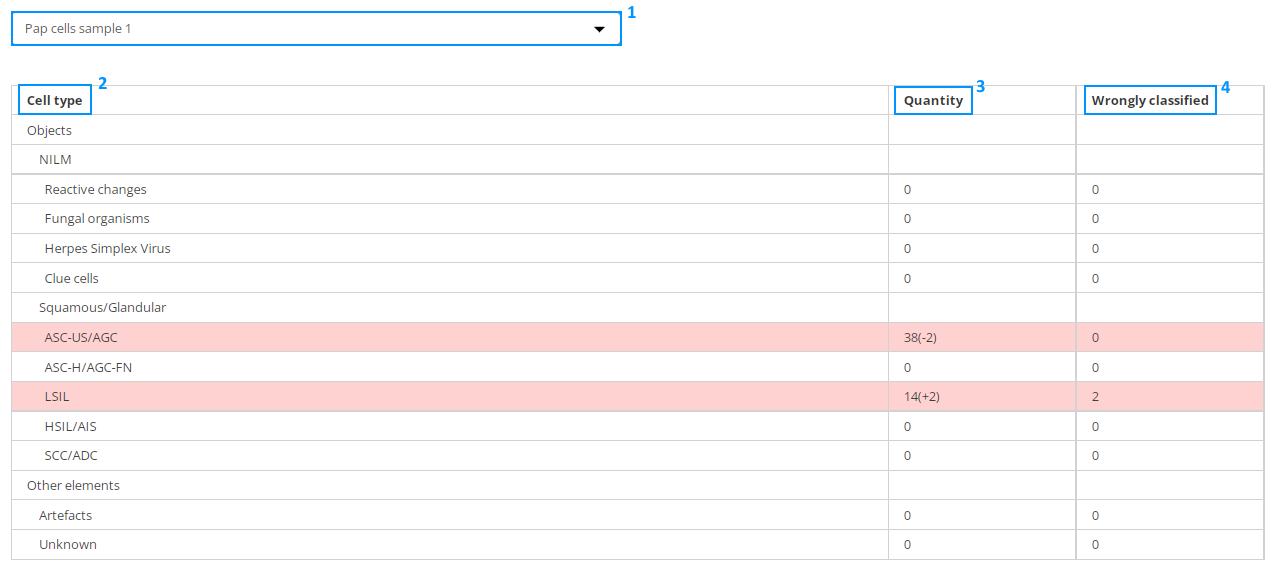
This tab displays a table with the results of cell identification for the sample selected in the drop-down list (1).
The table consists of three columns:
- Cell type (2);
- The number of cells of a specific type in the "A (B)" format, where A is the number of cells you selected, B is the number of missing and excessive cells with the "–" and "+" signs, respectively (3);
- The number of wrongly classified cells (4).
The rows with errors are highlighted in color.
"Cells" tab
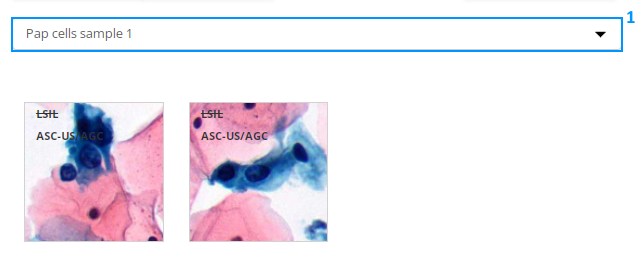
This tab displays a gallery of misclassified cells for the sample selected in the drop-down list (1).
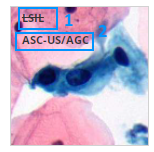
Each cell image displays the selected cell type (1) and the correct cell type (2).
"Interpretation" tab
This tab displays the results differently depending on the selection in the drop-down list.
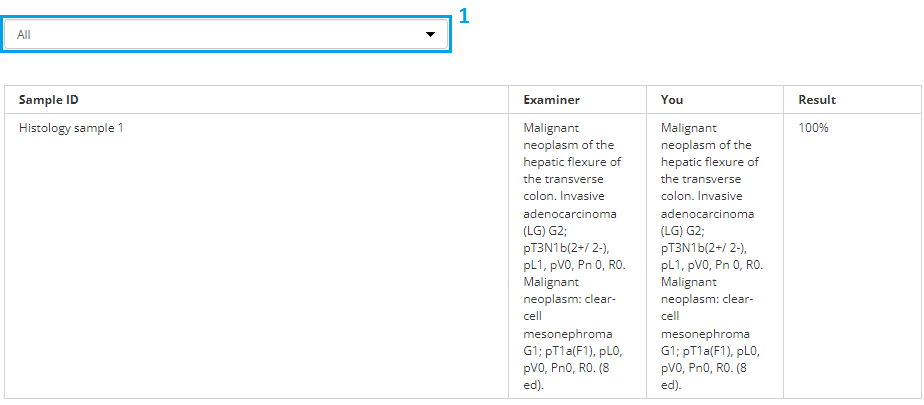
Results for all samples
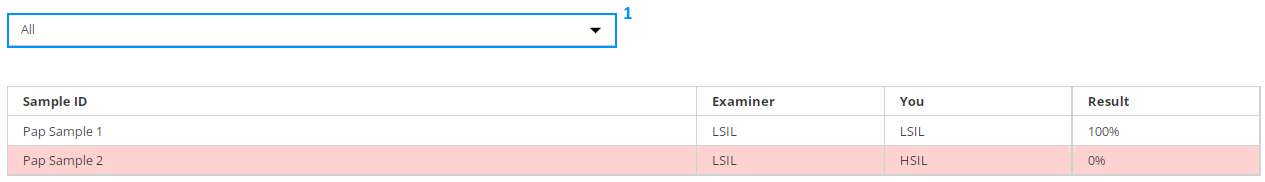
To view the results for all test samples, select "All" in the drop-down list (1).
A table with the following columns will be displayed:
- "Sample ID";
- "Examiner" — correct answer;
- "You" — your answer;
- "Result" — percentage of correct answers.
The rows with errors are highlighted in color.
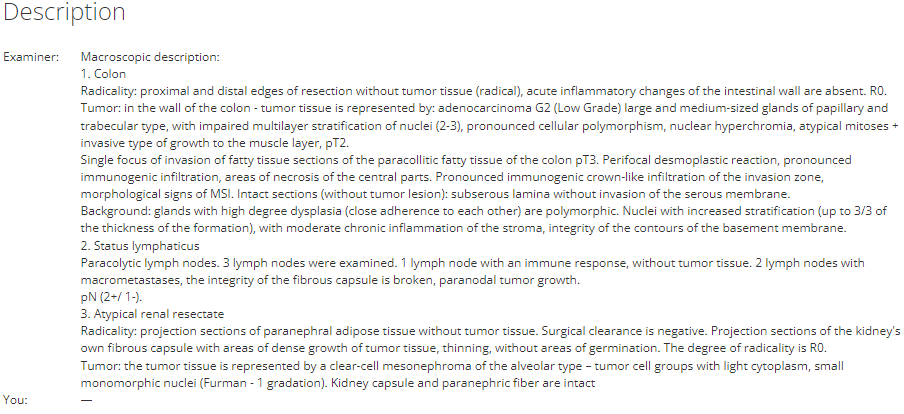
Result for a specific sample
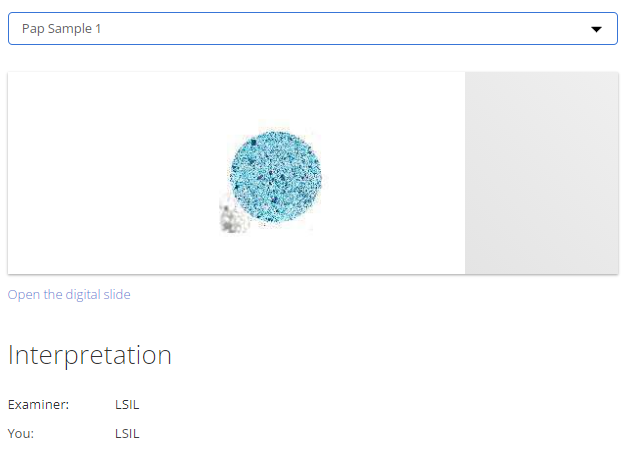
To view the result for a specific test sample, select the required sample in the drop-down list.
The page will display an image of the digital slide and the "Interpretation" section. Clicking on the image of the digital slide or the "Open the digital slide" link will take you to a new page with a detailed overview of the digital slide.
The "Interpretation" section displays a list with the following items:
- "Examiner" — correct answer;
- "You" — your answer.
Viewing test reports for BF samples
The report switching panel consists of 3 tabs: "General", "Types", "Cells".
"General" tab
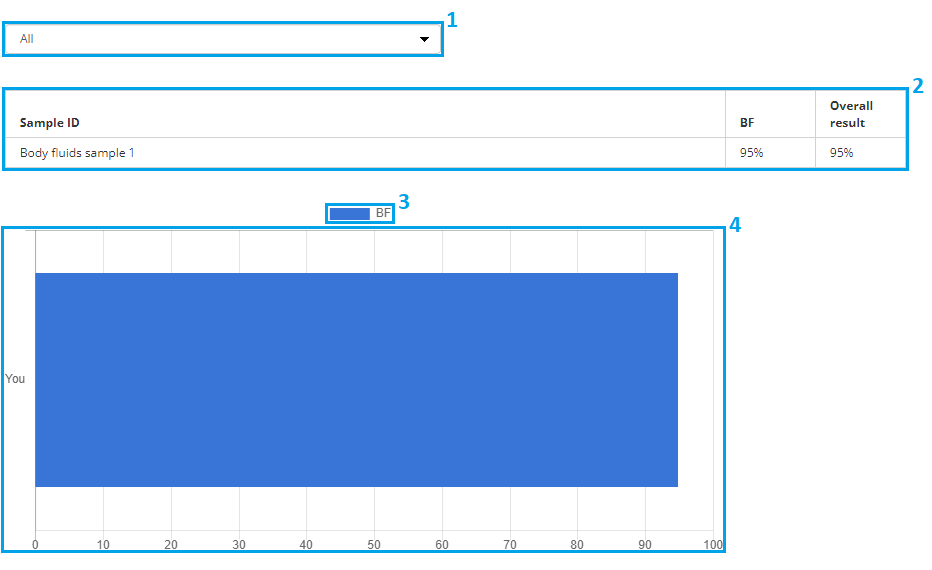
This tab displays basic information about the test.
- Drop-down list (1), where you can select a specific sample or all samples;
- Table with results for all samples in percentage points (2);
- Legend (3);
- Diagram (4).
When you select a specific sample in the drop-down list (1), the description of the interpretation is displayed under the diagram.
"Types" tab
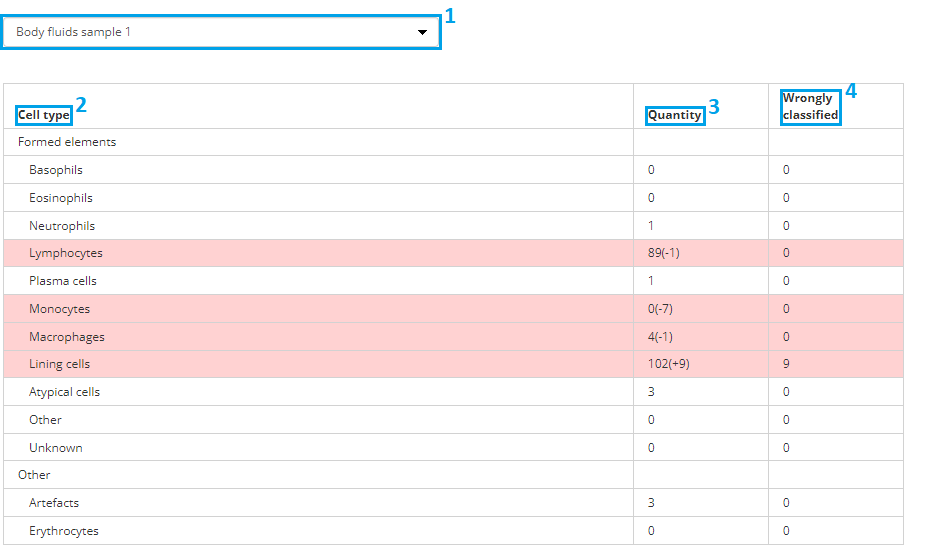
This tab displays a table with the results of cell identification for the sample selected in the drop-down list (1).
The table consists of three columns:
- Cell type (2);
- The number of cells of a specific type in the "A (B)" format, where A is the number of cells you selected, B is the number of missing and excessive cells with the "–" and "+" signs, respectively (3);
- The number of wrongly classified cells (4).
The rows errors are highlighted in color.
"Cells" tab
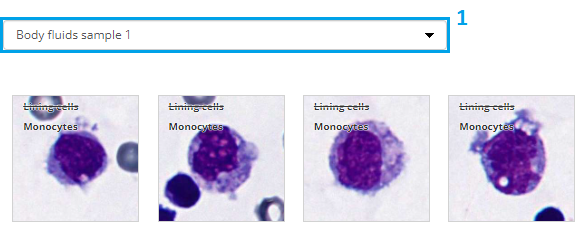
This tab displays a gallery of misclassified cells for the sample selected in the drop-down list (1).
Each cell image displays the selected cell type (1) and the correct cell type (2).
Viewing test reports for Histo and Cyto samples
The report switching panel consists of 2 tabs: “General” and “Interpretation”.
"General" tab
This tab displays basic information about the test.
- Drop-down list (1), where you can select a specific sample or all samples;
- Table with results for all samples in percentage points (2);
- Legend (3);
- Diagram (4).
When you select a specific sample in the drop-down list (1), the description of the interpretation is displayed under the diagram.
"Interpretation" tab
This tab displays the results differently depending on the selection in the drop-down list.
Results for all samples
To view the results for all test samples, select "All" in the drop-down list (1).
A table with the following columns will be displayed:
- "Sample ID";
- "Examiner" — correct answer;
- "You" — your answer;
- "Result" — percentage of correct answers.
The rows with errors are highlighted in color.
Result for a specific sample
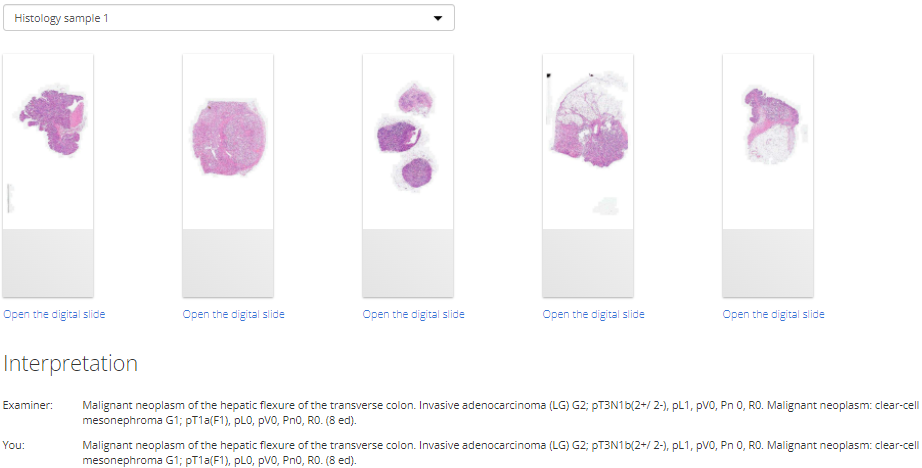
To view the result for a specific test sample, select the required sample in the drop-down list.
The page will display an image of the digital slide and the "Interpretation" section. Clicking on the image of the digital slide or the "Open the digital slide" link will take you to a new page with a detailed overview of the digital slide.
The "Interpretation " section displays a list with the following items:
- "Examiner" — correct answer;
- "You" — your answer.
Viewing test reports for STDs samples
The report switching panel consists of 2 tabs: “General” and “Interpretation”.
"General" tab

This tab displays basic information about the test.
- Drop-down list (1), where you can select a specific sample or all samples;
- Table with results for all samples in percentage points (2);
- Legend (3);
- Diagram (4).
When you select a specific sample in the drop-down list (1), the description of the interpretation is displayed under the diagram.
"Interpretation" tab
This tab displays the results differently depending on the selection in the drop-down list.
Results for all samples
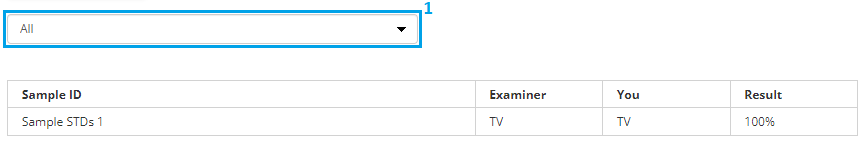
To view the results for all test samples, select "All" in the drop-down list (1).
A table with the following columns will be displayed:
- "Sample ID";
- "Examiner" — correct answer;
- "You" — your answer;
- "Result" — percentage of correct answers.
The rows with errors are highlighted in color.
Result for a specific sample
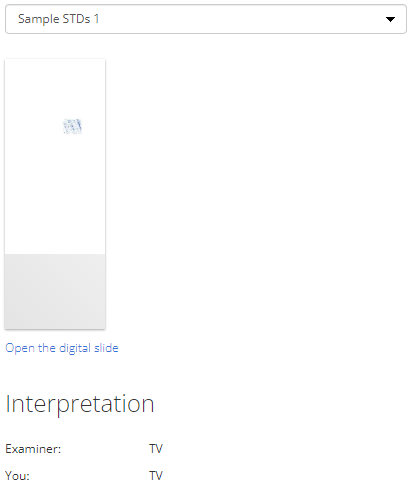
To view the result for a specific test sample, select the required sample in the drop-down list.
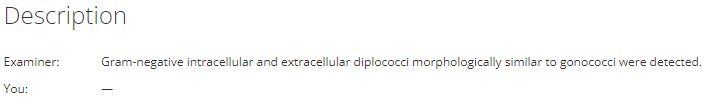
The page will display an image of the digital slide and the "Interpretation" section. Clicking on the image of the digital slide or the "Open the digital slide" link will take you to a new page with a detailed overview of the digital slide.
The "Interpretation " section displays a list with the following items:
- "Examiner" — correct answer;
- "You" — your answer.
Viewing test reports for Microbiology samples
The report switching panel consists of 2 tabs: “General” and “Flags”.
“General” tab
This tab displays basic information about the test.
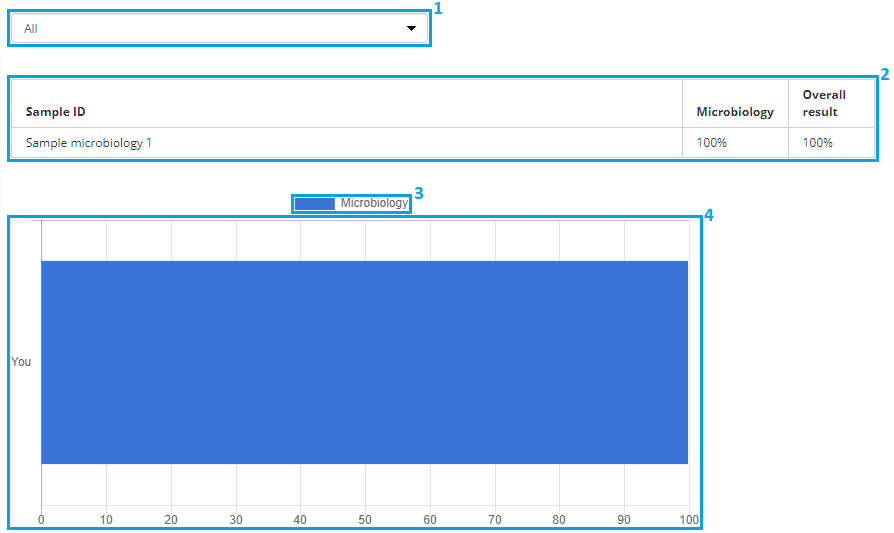
- Drop-down list (1), where you can select a specific sample or all samples;
- Table with results for all samples in percentage points (2);
- Legend (3);
- Diagram (4).
When you select a specific sample in the drop-down list (1), the description of the interpretation is displayed under the diagram.
“Flags” tab
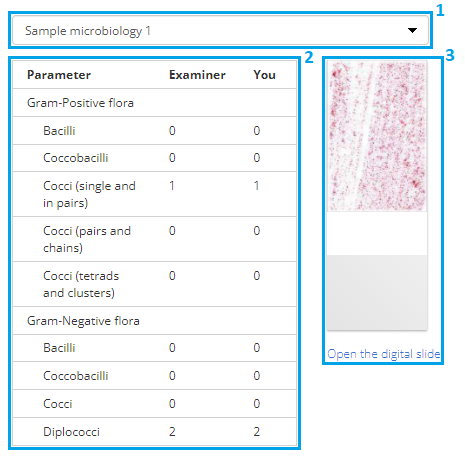
This tab displays a table with the results of determining the parameters (2) and the image of the digital slide with a link (3), depending on the selection in the drop-down list (1). The table consists of the following columns:
- Parameter;
- Examiner — correct answer;
- You — your answer.
The rows errors are highlighted in color.
Clicking on the image of the digital slide or the "Open the digital slide" link will take you to a new page with a detailed overview of the digital slide.